

Energy, better understood
Less waste.
In every kind of space.
Homes, workplaces and commercial environments use electricity differently.
Explore an equally considered example for each.
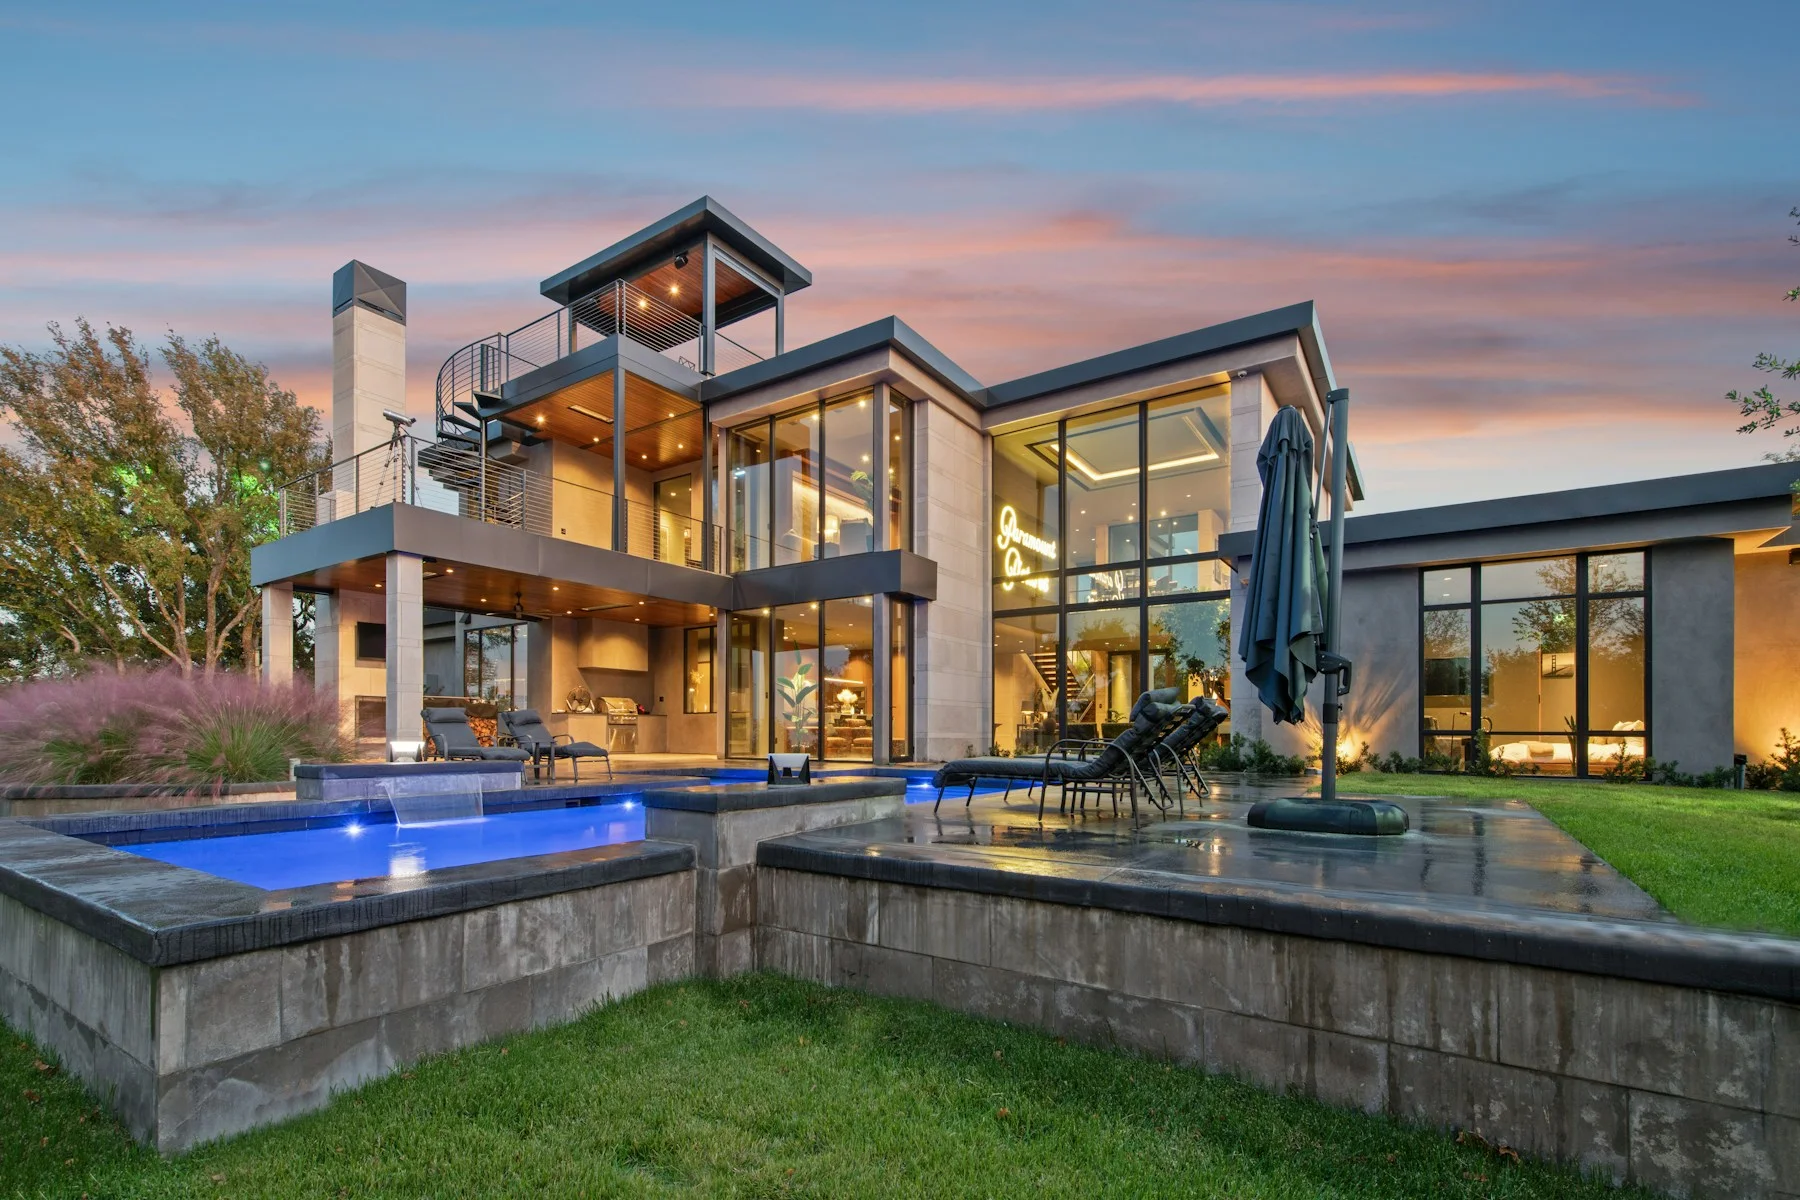
Comfort, considered.
Waste, reconsidered.
Figures, not vague promises
Different spaces.
The same clarity.
A four-zone private residence, with two inverter ACs and everyday lighting. Adjust hours, operating days and your assumed tariff to see what the selected controls could avoid—not a promised result.
Choose devices in this modelNot an official or live tariff. Use the marginal rate on your own bill. Fixed charges, tax, seasonal changes and tariff slabs are excluded.
One transparent method. Three baselines.
The thinking
behind the figures.
All models use the same sequential calculation engine. The loads, operating days and relevant zones differ by environment.
What is included in each example?
Cooling = average assumed kW × daily active hours × operating days. Lighting uses the zone’s stated lighting hours, or the active hours you select for the workplace and commercial examples. Standby includes only the explicitly listed non-essential loads.
Homes baseline · 8 active hours/day · 30 days/month
A four-zone private residence, with two inverter ACs and everyday lighting.
| Zone | Cooling | Lighting | Selected standby |
|---|---|---|---|
| Living room | 0.9 kW | 0.16 kW × 5 h/day | 0 kW × 0 h/day |
| Bedroom | 0.9 kW | 0.08 kW × 5 h/day | 0 kW × 0 h/day |
| Kitchen | 0 kW | 0.1 kW × 5 h/day | 0.08 kW × 10 h/day |
| Entrance | 0 kW | 0.06 kW × 10 h/day | 0 kW × 0 h/day |
Workplaces baseline · 10 active hours/day · 26 days/month
A four-zone office floor with a work area, meeting room, reception and support area.
| Zone | Cooling | Lighting | Selected standby |
|---|---|---|---|
| Work area | 2.4 kW | 0.45 kW × active h/day | 0.12 kW × 10 h/day |
| Meeting room | 1.4 kW | 0.18 kW × active h/day | 0.06 kW × 10 h/day |
| Reception | 0.6 kW | 0.14 kW × active h/day | 0 kW × 0 h/day |
| Pantry & support | 0 kW | 0.09 kW × active h/day | 0.2 kW × 12 h/day |
Commercial baseline · 12 active hours/day · 30 days/month
A retail-showroom example with display floor, customer lounge, frontage and stockroom. Clinics and hospitality require their own site assessment.
| Zone | Cooling | Lighting | Selected standby |
|---|---|---|---|
| Display floor | 4.5 kW | 0.85 kW × active h/day | 0.15 kW × 12 h/day |
| Customer lounge | 1.5 kW | 0.2 kW × active h/day | 0 kW × 0 h/day |
| Frontage & signs | 0 kW | 0.35 kW × active h/day | 0.1 kW × 12 h/day |
| Stockroom | 0 kW | 0.15 kW × active h/day | 0.3 kW × 12 h/day |
Which reduction factors are assumed?
Climate control reduces modelled cooling by 18%. Shading reduces remaining cooling by 10%. Presence sensing reduces remaining cooling by 8% only when paired with climate control in that zone. Lighting control reduces lighting by 35%; paired presence sensing reduces remaining lighting by 20%.
Monitoring receives no saving on its own. With a selected power control and enabled scheduling, the example’s non-essential standby load reduces by 50%. Access controls receive no electricity-saving credit. The percentages are illustrative planning factors, not independently validated Intel Spaces performance results.
Two cooling measures = baseline × (1 − 0.18) × (1 − 0.10), not a 28% reduction.
How is the empty-zone test different?
The interactive test shows instantaneous assumed demand after a configured timeout. A paired sensor can switch a selected climate or lighting control off. The closing scenario can also switch scheduled non-essential standby loads off. The unattended baseline assumes those loads were left on; manual switching can also prevent that waste. These tests do not change the monthly usage assumptions or add a second saving.
What should you not assume?
These are modelled loads, not an entire property’s audited bill. Existing controls, behaviour, orientation, insulation, equipment and the actual tariff can change the outcome. Essential IT, refrigeration, medical and emergency loads are not scheduled off. A retail-showroom example is not a specification for every shop, clinic, hotel or factory.
Further reading
- U.S. Department of Energy — Thermostats
- U.S. Department of Energy — Lighting controls
- NEPRA — Pakistan’s electricity regulator
These sources explain energy-control principles. They do not validate our illustrative model factors. Consult the applicable utility’s official notices for your tariff.
A little clarity
A few things you might be wondering.
Good decisions begin with clear answers.
How much could my home, office or commercial space save?
The amount depends on existing waste, usage, devices and the applicable tariff. Choose the relevant model, review its baseline and adjust the assumptions. A site-specific estimate requires actual consumption data and equipment details; the model is not a guarantee.
Can I compare the three example percentages directly?
Only as illustrations of the selected model loads. The home, office and showroom have different baseline demand and operating patterns. A higher percentage or PKR value does not prove a better product or predict savings at your property.
Are any hardware or service prices included?
No. PKR figures refer only to estimated reductions in modelled electricity charges. The models do not publish hardware prices, installation fees, quotations or payback calculations.